
Mathematics, 16.07.2019 12:30 Shavaila18
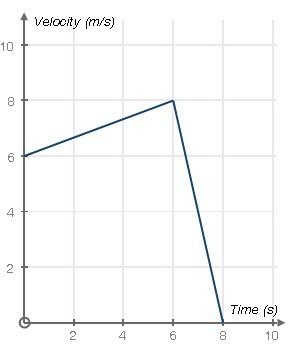
The graph below shows the velocity f(t) of a runner during a certain time interval which of the following describes the intercepts on the graph? (1 point) the initial acceleration of the runner was 8 m/s2, and the runner stopped after 6 seconds. the initial acceleration of the runner was 6 m/s2, and the runner stopped after 8 seconds. the initial velocity of the runner was 8 m/s, and the runner stopped after 6 seconds. the initial velocity of the runner was 6 m/s, and the runner stopped after 8 seconds.

Answers: 1


Other questions on the subject: Mathematics
You know the right answer?
The graph below shows the velocity f(t) of a runner during a certain time interval which of the foll...
Questions in other subjects:

History, 17.11.2020 19:20

Mathematics, 17.11.2020 19:20

Mathematics, 17.11.2020 19:20
Mathematics, 17.11.2020 19:20


