
Mathematics, 18.07.2019 00:30 shardaeheyward139
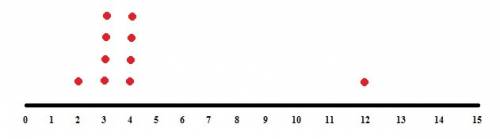
Agroup of 10 students participated in a quiz competition. their scores are shown below: 4, 4, 3, 4, 3, 12, 4, 3, 2, 3 part a: would a dot plot, a histogram, or a box plot best represent the data shown above if the purpose of the graph is to highlight the frequency of each individual score? explain your answer. (4 points) part b: provide a step-by-step description of how you would create the graph named in part a. (6 points)

Answers: 1


Other questions on the subject: Mathematics
Mathematics, 22.06.2019 02:30, oliviapolerop7209
Anne plans to increase the prices of all the items in her store by 5%. to the nearest cent, how much will an artist save if the artist buys a canvas and a frame that each measure 24 by 36 inches before the price increase goes into effect?
Answers: 1
Mathematics, 22.06.2019 03:30, briansalazar17
Which phrase generalizes the specific terminology bolded in the text?
Answers: 1
You know the right answer?
Agroup of 10 students participated in a quiz competition. their scores are shown below: 4, 4, 3, 4,...
Questions in other subjects:
Mathematics, 22.04.2021 15:30

Mathematics, 22.04.2021 15:30

Social Studies, 22.04.2021 15:30
Mathematics, 22.04.2021 15:30

English, 22.04.2021 15:30


