
Mathematics, 18.07.2019 13:00 jjmo
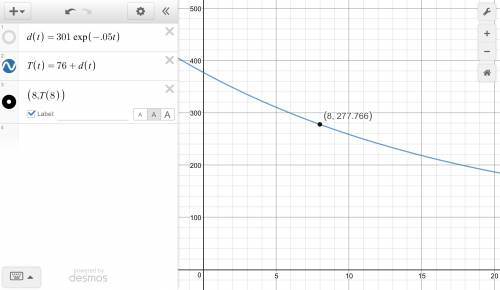
Apan is heated to 377°f, then removed from the heat and allowed to cool in a kitchen where the room temperature is a constant 76°f. the formula below can be used to find d, the difference in temperature between the pan and the room after t minutes. d = 301e-0.05t what is the approximate temperature of the pan after it has been away from the heat for 8 minutes? a. 277.8°f b. 201.8°f c. 125.8°f d. 525°f

Answers: 1


Other questions on the subject: Mathematics
Mathematics, 21.06.2019 12:50, xojade
Plz, ! the box plot below shows the total amount of time, in minutes, the students of a class surf the internet every day: a box plot is shown. part a: list two pieces of information that are provided by the graph and one piece of information that is not provided by the graph. (4 points) part b: calculate the interquartile range of the data, and explain in a sentence or two what it represents. (4 points) part c: explain what affect, if any, there will be if an outlier is present. (2 points)
Answers: 3
Mathematics, 21.06.2019 16:00, kell22wolf
Part one: measurements 1. measure your own height and arm span (from finger-tip to finger-tip) in inches. you will likely need some from a parent, guardian, or sibling to get accurate measurements. record your measurements on the "data record" document. use the "data record" to you complete part two of this project. name relationship to student x height in inches y arm span in inches archie dad 72 72 ginelle mom 65 66 sarah sister 64 65 meleah sister 66 3/4 67 rachel sister 53 1/2 53 emily auntie 66 1/2 66 hannah myself 66 1/2 69 part two: representation of data with plots 1. using graphing software of your choice, create a scatter plot of your data. predict the line of best fit, and sketch it on your graph. part three: the line of best fit include your scatter plot and the answers to the following questions in your word processing document 1. 1. which variable did you plot on the x-axis, and which variable did you plot on the y-axis? explain why you assigned the variables in that way. 2. write the equation of the line of best fit using the slope-intercept formula $y = mx + b$. show all your work, including the points used to determine the slope and how the equation was determined. 3. what does the slope of the line represent within the context of your graph? what does the y-intercept represent? 5. use the line of best fit to you to describe the data correlation.
Answers: 2
Mathematics, 21.06.2019 18:40, rivera8
Juliana says that she can use the patterns of equivalent ratios in the multiplication table below to write an infinite number of ratios that are equivalent to 6: 10. which statement explains whether juliana is correct? she is correct because she can multiply 6 and 10 by any number to form an equivalent ratio. she is correct because 6: 10 can be written as 1: 2 and there are an infinite number of ratios for 1: 2. she is not correct because the multiplication table does not include multiples of 10. she is not correct because 6: 10 is equivalent to 3: 5 and there are only 9 ratios in the multiplication table that are equivalent to 3: 5.
Answers: 1
You know the right answer?
Apan is heated to 377°f, then removed from the heat and allowed to cool in a kitchen where the room...
Questions in other subjects:
Mathematics, 21.10.2019 20:30

History, 21.10.2019 20:30


Biology, 21.10.2019 20:30


History, 21.10.2019 20:30

Social Studies, 21.10.2019 20:30


