
Mathematics, 19.07.2019 09:00 christophercordero15
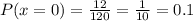
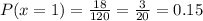
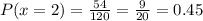
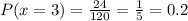
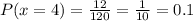
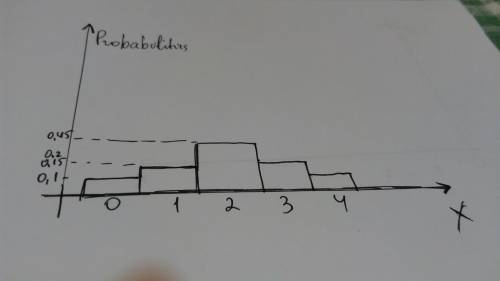
In an experiment, a deck of cards containing different colored cards is shuffled. four cards are randomly selected and the number of green cards selected is recorded. one hundred twenty trials of the experiment are run. the table shows the frequency of 0, 1, 2, 3, or 4 green cards occurring in the trials. number of green cards 0 1 2 3 4 frequency 12 18 54 24 12 create a probability distribution for the discrete variable. drag the sliders on the horizontal axis to represent the probability distribution.

Answers: 1


Other questions on the subject: Mathematics
Mathematics, 22.06.2019 03:30, damienlopezram
Miranda drove her car 112 miles on a 4 gallons of gas and 182 miles on 6.5 gallons. how many gallons would she need to drive 420 miles?
Answers: 1
You know the right answer?
In an experiment, a deck of cards containing different colored cards is shuffled. four cards are ran...
Questions in other subjects:

Physics, 05.07.2019 08:00
Mathematics, 05.07.2019 08:00


History, 05.07.2019 08:00
Mathematics, 05.07.2019 08:00


