
Mathematics, 20.07.2019 08:00 kirsten39
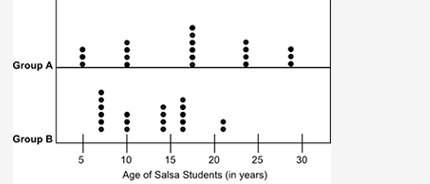
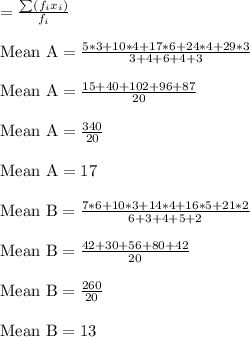
The dot plots below show the ages of students belonging to two groups of salsa classes: based on visual inspection, which group most likely has a lower mean age of salsa students? explain your answer using two or three sentences. make sure to use facts to support your answer. i need with group b

Answers: 1


Other questions on the subject: Mathematics
Mathematics, 21.06.2019 19:30, Animallover100
Write the sine and cosine values of a, b, respectively, in the figure for (1) and (2) + explanation.
Answers: 1
Mathematics, 22.06.2019 00:00, MissSmartyPants88
Multiply and simplify. (x - 4) (x^2 – 5x – 6) i will mark brainliest if your answer is right. show how you got the answer. if your answer is correct but does not show how you got the answer you will not be marked brainliest.
Answers: 3
Mathematics, 22.06.2019 02:00, jadajones5313
The resumâ´es of two male applicants for a college teaching position in chemistry are placed in the same file as the resumâ´es of two female applicants. two positions become available, and the first, at the rank of assistant professor, is filled by selecting one of the four applicants at random. the second position, at the rank of instructor, is then filled by selecting at random one of the remaining three applicants. using the notation m2f1, for example, to denote the simple event that the first position is filled by the second male applicant and the second position is then filled by the first female applicant, (a) list the elements of a sample space s; (b) list the elements of s corresponding to event a that the position of assistant professor is filled by a male applicant; (c) list the elements of s corresponding to event b that exactly one of the two positions is filled by a male applicant; (d) list the elements of s corresponding to event c that neither position is filled by a male applicant; (e) list the elements of s corresponding to the event a â© b; (f) list the elements of s corresponding to the event a âş c; (g) construct a venn diagram to illustrate the intersections and unions of the events a, b, and c.
Answers: 3
Mathematics, 22.06.2019 03:40, calibaby1220
Assume that females have pulse rates that are normally distributed with a mean of mu equals 72.0 beats per minute and a standard deviation of sigma equals 12.5 beats per minute. complete parts (a) through (c) below. a. if 1 adult female is randomly selected, find the probability that her pulse rate is between 65 beats per minute and 79 beats per minute. the probability is? b. if 16 adult females are randomly selected, find the probability that they have pulse rates with a mean between 65 beats per minute and 79 beats per minute. the probability is? c. why can the normal distribution be used in part (b), even though the sample size does not exceed 30?
Answers: 3
You know the right answer?
The dot plots below show the ages of students belonging to two groups of salsa classes: based on vi...
Questions in other subjects:

Computers and Technology, 29.01.2020 05:47


Mathematics, 29.01.2020 05:47


