Last questions! i need an 80% or above to pass !
the circle graph below shows the percentage...

Mathematics, 01.12.2019 00:31 dswitz6604
Last questions! i need an 80% or above to pass !
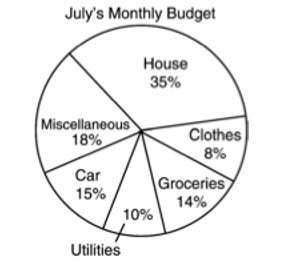
the circle graph below shows the percentages of mrs. frederick’s monthly budget for july. her total monthly income is $2,800.
pie chart below
in august’s monthly budget, mrs. frederick spent $126 more on clothes than she did in july. in august, what percentage of her monthly income of $2,800 was spent on clothes?
a 15%
b 12.5%
c 11.5%
d 10%
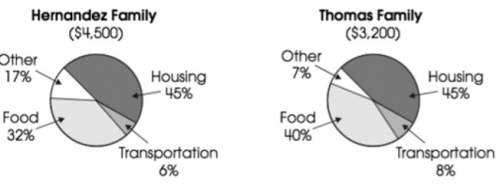
the hernandez family has a monthly income of $4,500. the thomas family has a monthly income of $3,200. the two circle graphs show the monthly budgets of two families.
pie charts below
which statement is supported by the data in the two graphs?
a the thomas family spends more dollars each month on transportation than the hernandez family does.
b the hernandez family spends more dollars each month on food than the thomas family does.
c both families spend more dollars on “other” than on transportation.
d both families spend the same amount of dollars each month on housing.
hassan deposited $7,500 into a bank account. at the end of 3 years, the account had earned $900 in simple interest. what rate of interest did the account earn per year?
a 2.78%
b 4%
c 8.33%
d 12%
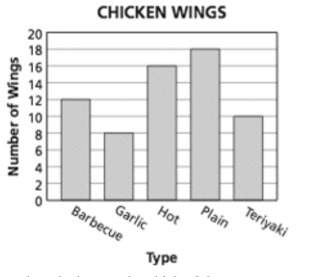
mr. wilt prepares some chicken wings for a picnic. the bar graph below shows the number of different types of wings he prepares.
bar graph below
based on the bar graph, which of these statements is true?
a mr. wilt prepares 2 more plain wings than hot wings.
b mr. wilt prepares twice as many plain wings as hot wings.
c mr. wilt prepares 2 more barbecue wings than garlic wings.
d mr. wilt prepares twice as many barbecue wings as garlic wings.
which of the following would be best represented by a circle graph?
a the heights of different types of trees
b the number of votes for each of 5 candidates for class president
c theamountofwaterthatfilledasinkafter 1,2, 3, and 4 minutes
d the number of hours each student studied compared to their grades on a test
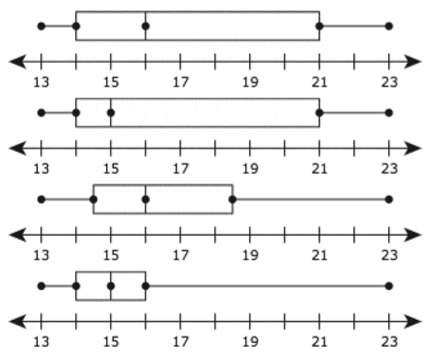
the ages of the members of a volunteer group are shown below. 13, 14, 14, 14, 15, 15, 15, 16, 16, 21, 23 which box and whisker plot best represents these data?
data below
a
b
c
d

Answers: 3


Other questions on the subject: Mathematics
Mathematics, 22.06.2019 02:30, jujurocks10
Which problem would you use the following proportion to solve for? 24/x = 40/100 a. what is 40% of 24? b. what percent is 24 of 40? c. twenty-four is 40% of what number? d. forty percent of 24 is what number?
Answers: 1
Mathematics, 22.06.2019 03:00, foziasif9525
Gia opened two savings accounts at two different banks. one account earns an annual 3.4% simple interest, and the other earns half as much. if she deposited $500 in each account, how much total interest will she have earned in 5 years? a. $34.00 b. $25.50 c. $51.00 d. $510.00
Answers: 1
You know the right answer?
Questions in other subjects:

Social Studies, 11.01.2020 21:31

Mathematics, 11.01.2020 21:31


History, 11.01.2020 21:31
Mathematics, 11.01.2020 21:31
English, 11.01.2020 21:31
Mathematics, 11.01.2020 21:31
English, 11.01.2020 21:31


