
History, 24.10.2019 10:43 rachelsweeney10
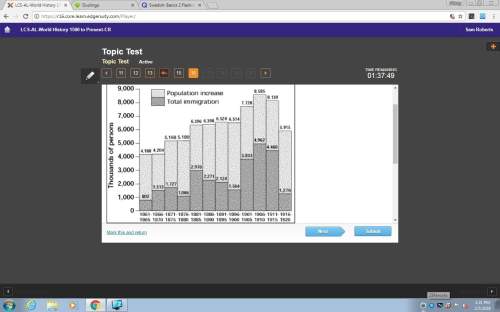
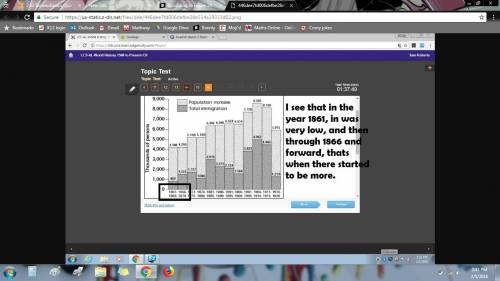
According to figure 24-1, between which years was the number of immigrants to the united states the least?
a.
1911–1915
c.
1876–1880
b.
1861–1865
d.
1866–1870

Answers: 3


Other questions on the subject: History
History, 21.06.2019 16:30, robertojr24ov5pel
Which of these were true of the sandinistas? select three options. they were led by daniel ortega.- they created the somoza dictatorship, they received aid from the ussr. they received aid from the u. s.they supported revolutions in el salvador.
Answers: 3
History, 21.06.2019 23:00, tiwaribianca475
How did margaret thatcher de-escalate the cold war
Answers: 1
You know the right answer?
According to figure 24-1, between which years was the number of immigrants to the united states the...
Questions in other subjects:

Social Studies, 30.10.2021 01:30


Mathematics, 30.10.2021 01:30

Chemistry, 30.10.2021 01:30


