
History, 23.05.2021 02:20 deonharris18
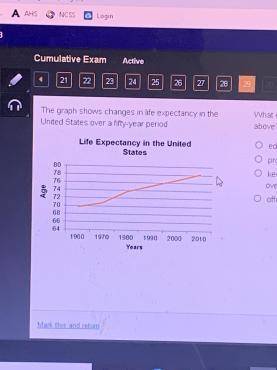
The graph shows changes in life expectancy in the United States over a fifty-year period.
A line graph titled Life Expectancy in the United States shows years on the x axis and age on the y axis. The line starts at 70 in 1960, to 71 in 1970, 74 in 1980, 75 in 1990, 76 in 2000, to 78 in 2010.
What challenge arose as a result of the trend shown above?
A. educating millions of school-age children
B. providing medical care for an aging population
C. keeping people from leaving the country to retire overseas
D. offering easy-to-follow voting registration procedures

Answers: 3


Other questions on the subject: History
History, 21.06.2019 19:00, pheonixhowls
If biblio is a word root meaning "book,” and phil means "love,” what is the best definition of bibliophile in the sentence below? elena was a bibliophile, so she amassed a library of thousands of books over the course of her life. someone who writes books someone who adores books someone who reads a lot of books someone who knows a lot about books
Answers: 1
History, 22.06.2019 04:00, tynasiaparks13
The ideas contained in the declaration of independence was most influenced by a. absolute monarchy b. the federal system c. anti-authoritarianism d. the social contract theory
Answers: 1
History, 22.06.2019 04:30, toricepeda82
The had established a temporary government only 3 days earlier
Answers: 1
You know the right answer?
The graph shows changes in life expectancy in the United States over a fifty-year period.
A line gr...
Questions in other subjects:

English, 31.01.2020 00:51

Mathematics, 31.01.2020 00:51
History, 31.01.2020 00:51


Social Studies, 31.01.2020 00:51
Biology, 31.01.2020 00:51


