
History, 23.05.2021 01:20 emilyy6425
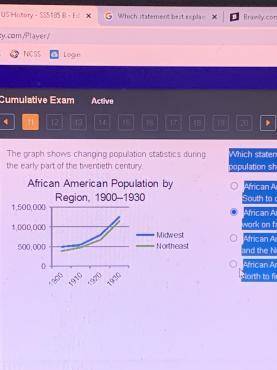
The graph shows changing population statistics during the early part of the twentieth century.
A line graph titled African American population by region, 1900 to 1930 shows years on the x axis and population numbers on the y axis. The line labeled midwest starts at 500,000 in 1900, to 600,000 in 1910, to 750,000 in 1920, to 1,250,000 in 1930. The line labeled northeast starts at 400,000 in 1900, to 500,000 in 1910, to 700,000 in 1920, to 1,200,000 in 1930.
Which statement best explains what caused this population shift?
A. African Americans moved from rural areas in the South to cities in the Midwest and the North.
B. African Americans left factories in the South to find work on farms in the Midwest and the North.
C. African Americans moved from cities in the Midwest and the North to rural areas in the South.
D. African Americans left factories in the Midwest and the North to find work on farms in the South

Answers: 2


Other questions on the subject: History
History, 22.06.2019 02:10, alicia432
Match the following events to the effects they produced. fall of constantinople italian wars hundred years’ war paved the way for the entry of renaissance ideas of peace and renewal arrowright caused an influx of classical greek and roman knowledge and texts into europe arrowright led to the introduction of renaissance thought and ideas to france arrowright
Answers: 3
You know the right answer?
The graph shows changing population statistics during the early part of the twentieth century.
A li...
Questions in other subjects:

Mathematics, 21.09.2021 14:00

Mathematics, 21.09.2021 14:00


Social Studies, 21.09.2021 14:00

Geography, 21.09.2021 14:00
Mathematics, 21.09.2021 14:00


