
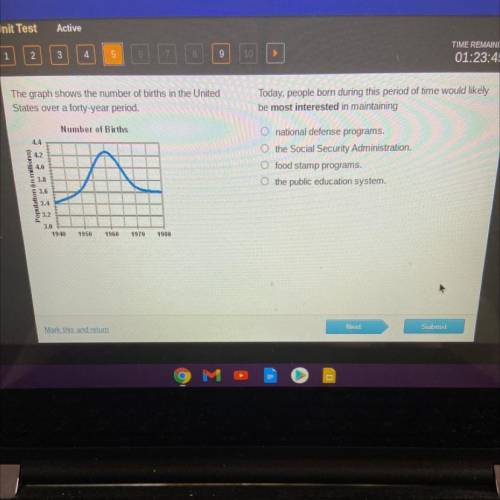
The graph shows the number of births in the United
States over a forty-year period.
Today, p...

History, 27.04.2021 21:20 janneemanoeee
The graph shows the number of births in the United
States over a forty-year period.
Today, people born during this period of time would likely
be most interested in maintaining
Number of Births
4.4
4.2
O national defense programs.
O the Social Security Administration.
O food stamp programs.
o the public education system.
4.0
Population in millions)
3.8
3.6
3.4
3.2
3.0
1940
1950
1960
1970
1980

Answers: 3


Other questions on the subject: History
History, 21.06.2019 21:30, bankscorneliuso39
What was the land like around rome? dry rocky fertile volcanic
Answers: 1
History, 21.06.2019 23:30, nataliaalejandradasi
In a word processing program, the ribbon or menus contain the name of the document commands total number of pages functions
Answers: 3
You know the right answer?
Questions in other subjects:


Mathematics, 13.11.2020 08:30

English, 13.11.2020 08:30
Mathematics, 13.11.2020 08:30

Mathematics, 13.11.2020 08:30

Spanish, 13.11.2020 08:30


