
History, 20.04.2021 21:20 jacob12049
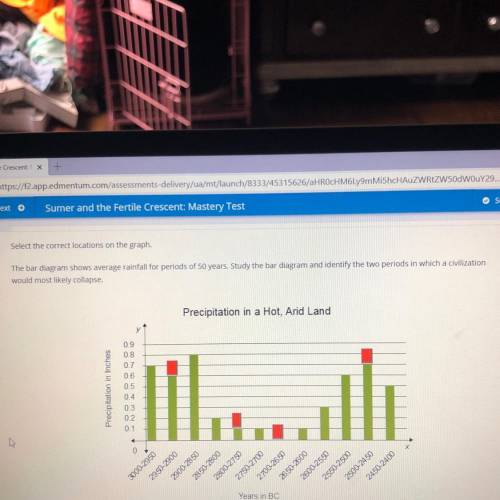
The bar diagram shows average rainfall for periods of 50 years. Study the bar diagram and identify the two periods in which a civilization
would most likely collapse.
Precipitation in a Hot, Arid Land
Precipitation in Inche
09
08
0.7
06
0.5
04
03
02
0.1
OOK OSEC
2700-2650
2000-2550
1700-2700
2650-2600
3000 2950
2950-2900
2300-2350
Years in BC
2550-2500
2500-2450
2450 2400

Answers: 3


Other questions on the subject: History
History, 21.06.2019 16:30, loxtin495
Which of the following best describes the state of the us economy at the end of world war ii? a it was starting to come out of the great depression. b it was out of the great depression and doing better. c it was one of the most powerful economies in the world. d it was entering another recession.
Answers: 1
History, 21.06.2019 18:00, andrwisawesome0
How did the relationship impact the desire of christian nations in the iberian peninsula to spread christianity?
Answers: 3
You know the right answer?
The bar diagram shows average rainfall for periods of 50 years. Study the bar diagram and identify t...
Questions in other subjects:

Mathematics, 04.02.2021 19:20

English, 04.02.2021 19:20

Mathematics, 04.02.2021 19:20
Mathematics, 04.02.2021 19:20

Health, 04.02.2021 19:20
Mathematics, 04.02.2021 19:20


