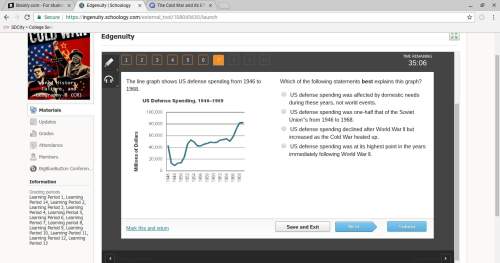
The line graph shows us defense spending from 1946 to 1968.
which of the following state...

History, 05.11.2019 09:31 kelseiroll8554
The line graph shows us defense spending from 1946 to 1968.
which of the following statements best explains this graph?
us defense spending was affected by domestic needs during these years, not world events.
us defense spending was one-half that of the soviet union'’s from 1946 to 1968.
us defense spending declined after world war ii but increased as the cold war heated up.
us defense spending was at its highest point in the years immediately following world war ii.

Answers: 3


Other questions on the subject: History
History, 21.06.2019 13:30, ashcormu11
Between the world wars eisenhower's presidency the 1960s what is the organizing principle of this list?
Answers: 1
History, 21.06.2019 23:00, macybarham
What changes did japanese militarists make when they came to power?
Answers: 2
History, 22.06.2019 04:30, josierednour285
Why might the greeck city states have an advantage over the persians
Answers: 2
History, 22.06.2019 08:30, yselahernandez02
Which consideration must be addressed when deciding for whom to produce? who can be most creative with the product? who has the largest resource pool? who has the greatest need? who can bring in the greatest profit?
Answers: 1
You know the right answer?
Questions in other subjects:


Mathematics, 22.08.2019 07:30

Social Studies, 22.08.2019 07:30


Mathematics, 22.08.2019 07:30
Mathematics, 22.08.2019 07:30


