
Refer to the graph.
A graph titled Total Deaths from Air Pollution by Region, 1990 and 2013 shows regions on the x axis and number of deaths on the y axis. The graph shows a downward trend from years 1990 to 2013 for Europe, Central Asia, and North America.
Which of the following best explains the change in number of deaths from air pollution in Europe and Central Asia and in North America from 1990 to 2013?
Reduced consumption of manufactured goods
Greater reliance on coal and natural gas for power
Falling birth rates resulting in smaller populations and less pollution
Increased government regulation of manufacturing and transportation
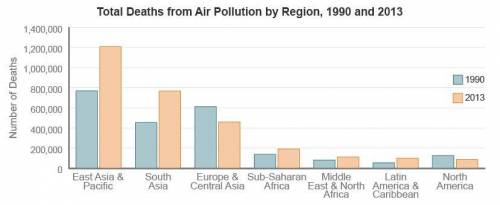

Answers: 1


Other questions on the subject: History
History, 22.06.2019 04:30, Delgadojacky0206
Which of the following is a likely reason that someone today might decide to move from a city in the midwest to the south? a. the decline of manufacturing in the midwest b. the many high tech jobs available in the south c. urban overcrowding in the midwest d. higher housing costs in the south
Answers: 1
History, 22.06.2019 07:30, Sumitco9578
In which ways did the durbar of 1877 mark a change for india? in which ways did india’s situation remain the same?
Answers: 1
History, 22.06.2019 09:30, KariSupreme
What was the goal of the united states' invasion at the bay of pigs?
Answers: 2
You know the right answer?
Refer to the graph.
A graph titled Total Deaths from Air Pollution by Region, 1990 and 2013 shows r...
Questions in other subjects:

Mathematics, 24.02.2021 06:00

Mathematics, 24.02.2021 06:00

English, 24.02.2021 06:00
Mathematics, 24.02.2021 06:00

Mathematics, 24.02.2021 06:00


