History, 15.04.2021 15:20 oroman4650
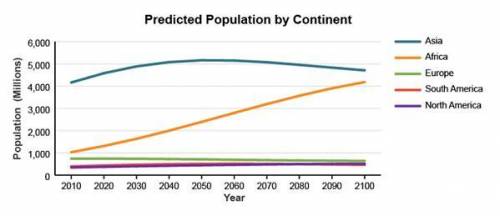
This graph shows predicted population by continent.
A line graph shows predicted population by continent, from 2010 to 2100. For the continents of North America, South America, and Europe, the population remains steady, under 1,000 for each. Asia is predicted to rise 5,100 by 2050 before slowly falling to 4,700 by 2100. Africa is predicted to steadily rise, from 1,000 in 2010 to 4,200 in 2100.
Which would be the most logical reason for Africa’s population growth?
higher birth rates
more land available to populate
fewer casualties in wars
high immigration rates


Answers: 2


Other questions on the subject: History

History, 21.06.2019 21:00, vanessa7676
Which mountain region leads the nation in producing young chickens? blue ridge appalachian plateau coastal plain ridge and valley
Answers: 1


History, 22.06.2019 06:00, casting479
Which side was right? write a paragraph in which you explain which side made a stronger argument and why. remember to use evidence from the lesson and from primary source documents you have read.
Answers: 3
You know the right answer?
This graph shows predicted population by continent.
A line graph shows predicted population by cont...
Questions in other subjects:


Mathematics, 29.07.2019 15:00

Biology, 29.07.2019 15:00


Biology, 29.07.2019 15:00


Mathematics, 29.07.2019 15:00


