
History, 15.04.2021 07:40 nikitakhrabkov123
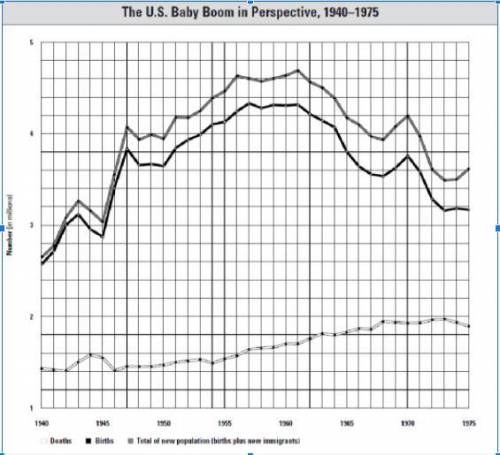
3. Look at the graph’s 1959 totals. What does the 4.30 level indicate?
What does the level of 4.60 indicate?
What does the level of 1.66 indicate?
By how much did the U. S. population increase in that year?
4. Nearly 60,000 more people immigrated to the United States in 1965 than in 1964.
Why then does the top line in the graph dip down between those years?
5. What is significant about the number of births in 1972? (Hint: Look at the number of births for the first year of the baby boom.)
Why do you think 1964 is considered the final year of the baby boom?
6. Contrast the patterns of births and deaths during the years 1940–1975.

Answers: 1


Other questions on the subject: History
History, 22.06.2019 02:00, electrofy456
In some african american communities, unemployment was as high as percent.
Answers: 1
History, 22.06.2019 11:00, bazsinghnagoke
How did its location near the sea most contribute to the growth of ancient greece? a. by supplying water for irrigating crops b. by providing easy access to trade routes c. by creating a natural barrier from enemies d. by generating power for watermills
Answers: 2
You know the right answer?
3. Look at the graph’s 1959 totals. What does the 4.30 level indicate?
What does the level of 4.60...
Questions in other subjects:


Mathematics, 22.06.2020 17:57

Social Studies, 22.06.2020 17:57
Social Studies, 22.06.2020 17:57

Mathematics, 22.06.2020 17:57


