17. The chart indicates a shift in population.
Which set of data could be linked with the
phe...

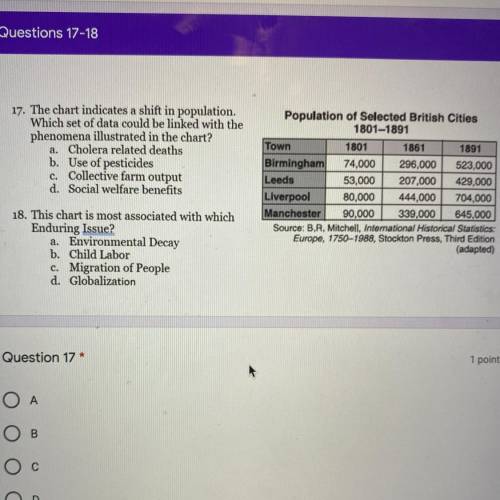
17. The chart indicates a shift in population.
Which set of data could be linked with the
phenomena illustrated in the chart?
a. Cholera related deaths
b. Use of pesticides
c. Collective farm output
d. Social welfare benefits
Population of Selected British Cities
1801-1891
Town
1801 1861 1891
Birmingham 74,000 296,000 523,000
Leeds
53,000 207,000 429,000
Liverpool 80,000 444,000 704,000
Manchester 90,000 339,000 645,000
Source: B. R, Mitchell, International Historical Statistics:
Europo, 1750-1988, Stockton Press, Third Edition
(adapted)
18. This chart is most associated with which
Enduring Issue?
a. Environmental Decay
b. Child Labor
c. Migration of People
d. Globalization

Answers: 2


Other questions on the subject: History
History, 22.06.2019 06:00, lelen2021
Wire campaign finance laws administered by the fec not well enforced? a campaign finance rules are difficult to enforce b the fec has been plagued by corruption? c the fec does not have enough staff or funding d the fec was only created by the america vote act of 2002
Answers: 3
History, 22.06.2019 06:30, gabrimccut
Who proposed the corwin amendment in early march of 1861
Answers: 1
History, 22.06.2019 07:30, isaiahrodriguezsm17
Which of the following factors care of many european nations to occupy and colonize nations in southeast asia
Answers: 1
You know the right answer?
Questions in other subjects:


Social Studies, 08.02.2022 21:50

Mathematics, 08.02.2022 21:50

Computers and Technology, 08.02.2022 21:50
Mathematics, 08.02.2022 21:50
Social Studies, 08.02.2022 21:50
SAT, 08.02.2022 21:50


