
History, 12.12.2020 16:10 daeshawnc14
Please Help
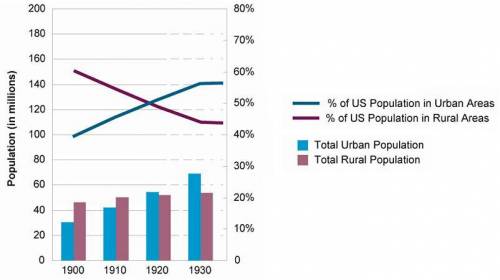
The graph below compares the size of the urban and rural population in the United States during the first four decades of the 20th century:
Which statement summarizes the information at the top half of this chart?
A) The total rural and urban population increased between 1900 and 1930.
B) The percentage of people in rural areas decreased, while the percentage of people in urban areas increased.
C) The percentage of people in urban areas decreased, while the percentage of people in rural areas increased.
D) The total rural population decreased while the total urban population increased.

Answers: 2


Other questions on the subject: History
History, 22.06.2019 07:00, maxi12312345
Which controversial political issue of the 1920 is reflected in the cartoon
Answers: 2
History, 22.06.2019 08:10, miagiancarlo
What was the name of the puritan group that wanted to separate from the church of england? a. quakers b. pilgrims c. catholics d. dissenters e. jews
Answers: 1
You know the right answer?
Please Help
The graph below compares the size of the urban and rural population in the United State...
Questions in other subjects:


Biology, 27.05.2020 22:04
English, 27.05.2020 22:04
Mathematics, 27.05.2020 22:04
Mathematics, 27.05.2020 22:04
Mathematics, 27.05.2020 22:04


