
History, 15.08.2020 21:01 jordanmjdmary8571
NEED A ANSWER ASAP ! Please ! (Graph provided)
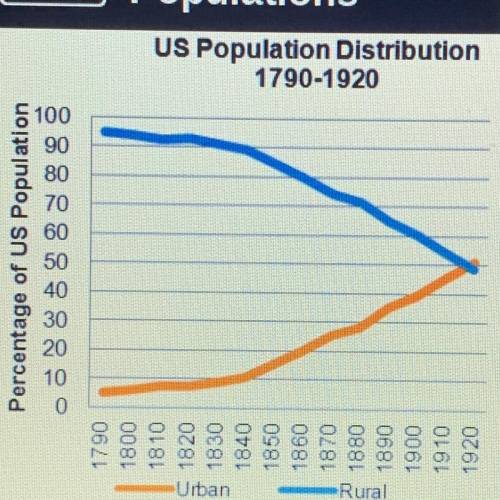
Question: Analyze the trends in this graph. Which statement
best reflects the data?
A) The percentage of people living in urban
areas decreased from 1790 to 1920.
B) The percentage of people living in urban
areas increased from 1790 to 1920.
C)The percentage of people living in urban
areas stayed the same from 1790 to 1920.

Answers: 3


Other questions on the subject: History
History, 22.06.2019 01:00, najsha
What role did mazzini play in italian unification? a.) he dreamed of a united italy and took the first steps to achieving it. b.) he conquered the southern part of italy, including sicily. c.) he was the first leader of a united italy. d.) he was assassinated by the french government, making him a martyr.
Answers: 1
You know the right answer?
NEED A ANSWER ASAP ! Please ! (Graph provided)
Question: Analyze the trends in this graph. Which st...
Questions in other subjects:

Mathematics, 30.04.2021 09:30

Chemistry, 30.04.2021 09:30
Mathematics, 30.04.2021 09:30

English, 30.04.2021 09:30

Biology, 30.04.2021 09:30
Biology, 30.04.2021 09:30


