Which statement accurately explains the data on this
graph?
The US population increased...

Which statement accurately explains the data on this
graph?
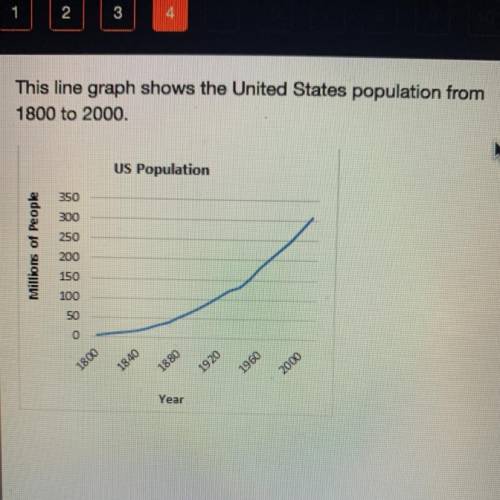
The US population increased at an even, upward rate
from 1800 through 2000.
The US population increased slowly at first, then sharply
during the twentieth century.
The US population experienced several ups and downs
during the two centuries shown.
The US population was unchanged in the 1800s and
only began to increase during the 1900s.

Answers: 3


Other questions on the subject: History
History, 21.06.2019 18:30, amandaaaa13
Which sentence best describes the effect of the bill of rights
Answers: 2
History, 22.06.2019 04:30, jessiebotello7209
Which is an effective question for launching history inquiry related to the cold war
Answers: 1
History, 22.06.2019 07:20, jackfrost5
Why did the mujahedeen receive us support even though they were against some american ideals
Answers: 2
You know the right answer?
Questions in other subjects:

History, 31.03.2020 04:25


Mathematics, 31.03.2020 04:25


