Which of the following inferences is supported by the graph?
The population in Europe i...

History, 03.05.2020 13:35 dianactorres
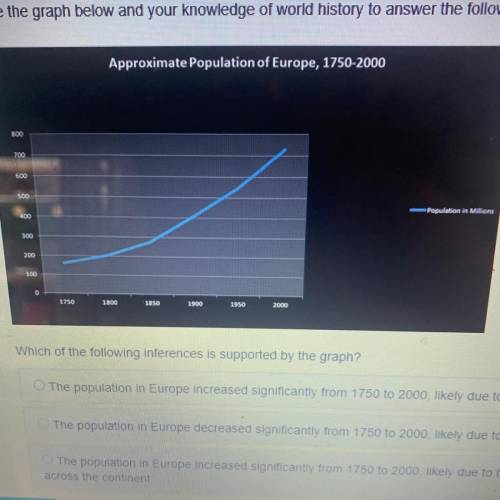
Which of the following inferences is supported by the graph?
The population in Europe increased significantly from 1750 to 2000, likely due to advancements encouraged by the scientific revolution.
The population in Europe decreased significantly from 1750 to 2000, likely due to brutal religious wars that plagued the region for centuries.
The population in Europe increase significantly from 1750 to 2000, likely due to the French Revolution, which drastically increased standards of living across the continent.
The population in Europe decrease significantly from 1750 to 2000, likely due to major epidemics that were commonplace after 1750.

Answers: 3


Other questions on the subject: History
History, 21.06.2019 23:40, gibesanna11p5nn28
What were the purposes of salt? check all of the boxes that apply. -to achieve peace -to protect the security of the united states -to form an alliance against communist nations - to stop the nuclear arms race - to give the united states an advantage over the soviet union
Answers: 3
History, 22.06.2019 06:00, erinharrington15
Why did alexander go primarily east and south from macedonia and greece in his conquest
Answers: 1
You know the right answer?
Questions in other subjects:

Mathematics, 26.05.2021 03:40
Mathematics, 26.05.2021 03:40

Mathematics, 26.05.2021 03:40
Mathematics, 26.05.2021 03:40
Mathematics, 26.05.2021 03:40
Mathematics, 26.05.2021 03:40


