History, 06.05.2020 04:27 tinajackson6534
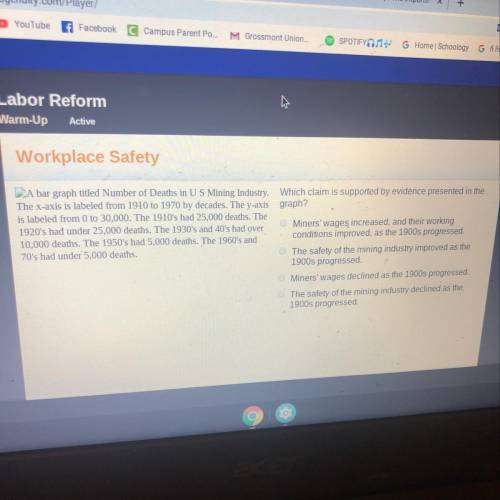
A bar graph titled Number of Deaths in US Mining Industry. Which claim is supported by evidence presented in the
The x-axis is labeled from 1910 to 1970 by decades. The y-axis graph?
is labeled from 0 to 30,000. The 1910's had 25,000 deaths. The
1920's had under 25,000 deaths. The 1930's and 40's had over
Miners' wages increased, and their working
conditions improved, as the 1900s progressed.
10,000 deaths. The 1950's had 5,000 deaths. The 1960's and
70's had under 5,000 deaths.
The safety of the mining industry improved as the
1900s progressed.
Miners' wages declined as the 1900s progressed.
The safety of the mining industry declined as the
1900s progressed


Answers: 2


Other questions on the subject: History


History, 22.06.2019 04:00, sbhunsaker9722
What explains the political difference among african americans politicians during reconstruction
Answers: 1
You know the right answer?
A bar graph titled Number of Deaths in US Mining Industry. Which claim is supported by evidence pres...
Questions in other subjects:


Biology, 24.03.2021 19:00

English, 24.03.2021 19:00


Mathematics, 24.03.2021 19:00

Mathematics, 24.03.2021 19:00

Mathematics, 24.03.2021 19:00

Social Studies, 24.03.2021 19:00


