Look at the graph. Then answer the question.
1929 Drop in Stock Prices
A gra...

History, 09.04.2020 08:21 keshewar2671
Look at the graph. Then answer the question.
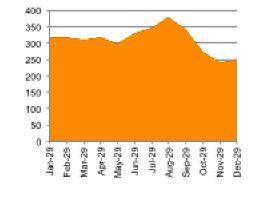
1929 Drop in Stock Prices
A graph titled 1929 Drop in Stock Prices shows dates on the horizontal axis and numbers on the vertical axis. Prices were constant around 300 from January to May, increased from 300 in May to 375 in August, decreased from 375 in August to 250 in November, and remained constant from November to December.
Which statement best explains what happened in the stock market from August to the end of October?
The market increased its value.
The market lost much of its value.
The market totally collapsed.
The market slowly inched upward.

Answers: 2


Other questions on the subject: History
History, 21.06.2019 22:30, sophiaaafaline
How did the united states obtained the purchase of floridia to extand its frontiers to the pacific ocean
Answers: 1
History, 21.06.2019 23:30, ayoismeisjjjjuan
When leaders use religious laws to govern, they most likey represent? a democracy, an autocratic you, a monarchy, a theocracy
Answers: 2
History, 22.06.2019 02:30, heroicblad
What does the second video tell you about life in the united states compared to life in russia?
Answers: 1
You know the right answer?
Questions in other subjects:


English, 30.07.2021 01:00

Mathematics, 30.07.2021 01:00
Mathematics, 30.07.2021 01:00


