
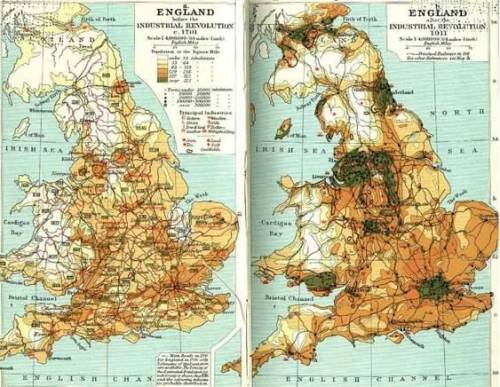
These maps show the population density of England at the start of the 18th and 20th Centuries. Darker colors represent a higher concentration of the population.
What can be concluded from the population density of England during this time period?
A) Families were torn apart due to factory labor.
B) England's population grew during the World Wars.
C) Textile manufacturing was no longer an economic factor.
D) The Industrial Revolution led to the growth of urban areas.

Answers: 1


Other questions on the subject: History
History, 21.06.2019 17:00, sryun
Ineed with what i should write for my research paper. my topic is history of slavery. 1800 words. all i need is what to write in each paragraphs. like when the research paper has titles for each paragraph and it explains the tile in each paragraph. for example when did slaverh begin? why did it begin like an outline.
Answers: 1
History, 22.06.2019 00:00, ayowazzzgood
Which source would best a historian understand the effect of the great chicago fire on families? a. a biography of a chicago family displaced by the fire b. a letter from a grandmother in new york to her family in chicago c. a newspaper editorial about families who were displaced d. an oral history dictated by an adolescent who fled the fire
Answers: 1
You know the right answer?
These maps show the population density of England at the start of the 18th and 20th Centuries. Darke...
Questions in other subjects:


Mathematics, 28.02.2021 23:10

English, 28.02.2021 23:10
Mathematics, 28.02.2021 23:10
Mathematics, 28.02.2021 23:10
English, 28.02.2021 23:10
Mathematics, 28.02.2021 23:10


