
History, 07.03.2020 01:29 jacobbecker99
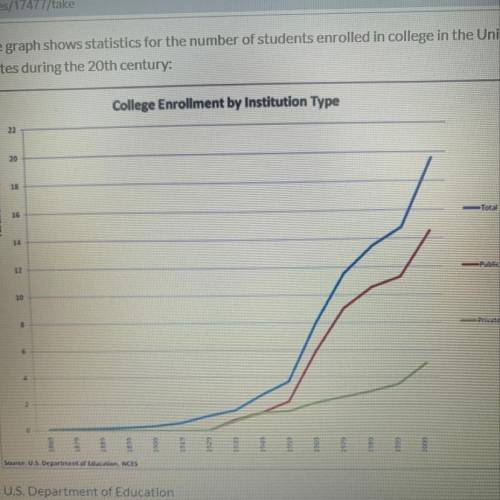
The graph shows statistics for the number of students enrolled in college in the United States during the 20th century:
U. S. department of education
which of the following made a significant contribution to the trend shown in the graph above?
A) the G. I. Bill
B) the civil rights act
C) brown v. Board of education
D) the equal rights amendment

Answers: 1


Other questions on the subject: History
History, 21.06.2019 21:00, Kalamazoo373
What is institutional discrimination in the social work field
Answers: 2
History, 22.06.2019 02:30, kaelynnmarie1135
Write 3 paragraphs on why the us should not have annexed the philippines
Answers: 2
History, 22.06.2019 04:00, 25linm
What do most climatologists see as a major cause of rising global temperatures? a. earth's closer proximity to the sun due to its gravitational pull b. greenhouse gases produced by burning fossil fuels c. rising ocean levels caused by melting polar ice sheets d. water pollution cause by industrial waste
Answers: 1
You know the right answer?
The graph shows statistics for the number of students enrolled in college in the United States durin...
Questions in other subjects:


Social Studies, 11.04.2020 23:13

Mathematics, 11.04.2020 23:14
Mathematics, 11.04.2020 23:15


Chemistry, 11.04.2020 23:17
Mathematics, 11.04.2020 23:22


