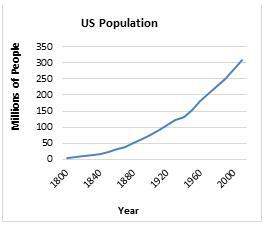
this line graph shows the united states population from 1800 to 2000.
which statement acc...

History, 24.01.2020 07:31 1230bering
this line graph shows the united states population from 1800 to 2000.
which statement accurately explains the data on this graph?
a)the us population increased at an even, upward rate from 1800 through 2000.
b)the us population increased slowly at first, then sharply during the twentieth century.
c)the us population experienced several ups and downs during the two centuries shown.
d)the us population was unchanged in the 1800s and only began to increase during the 1900s.
need asap

Answers: 2


Other questions on the subject: History
History, 22.06.2019 03:30, lujaynsparkles
Many blacks moved from the south to northern cities during world war li looking for employment. after the war, a number of them lost their jobs. why did this happen?
Answers: 1
History, 22.06.2019 10:00, smkw04p3ao0n
How did roosevelt corollary and dollar diplomacy affect u. s. relations with other countries?
Answers: 2
You know the right answer?
Questions in other subjects:


Mathematics, 11.02.2021 18:40


Chemistry, 11.02.2021 18:40

Biology, 11.02.2021 18:40
Mathematics, 11.02.2021 18:40
Mathematics, 11.02.2021 18:40


