Which of the following might you infer from the chart?
cotton was a scarcity in the 189...

Which of the following might you infer from the chart?
cotton was a scarcity in the 1890s.
cotton production was at an all-time high in 1865.
the economy in the south relied solely on cotton production in the 1890s.
the profitability of cotton farming was decreasing in the late 1800s.
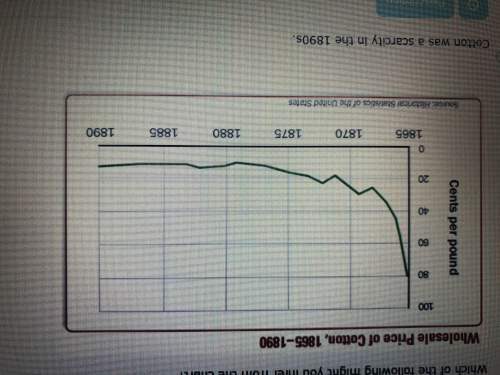

Answers: 2


Other questions on the subject: History
History, 21.06.2019 20:00, sweetluvs7865
How were the european systems of mercantilism and capitalism similar during the 18th and 19th century
Answers: 1
History, 21.06.2019 23:30, shavonfriend27
Which would make the best heading for this list of notes about the migration of african-americans during the reconstruction era?
Answers: 3
History, 22.06.2019 07:00, GreenHerbz206
Plz although president washington was not a member of the federalist party or the republican party his closest relationship was with, a. john adams. b. james madison. c. alexander hamilton. d. thomas jefferson.
Answers: 2
You know the right answer?
Questions in other subjects:

Health, 29.06.2019 10:30


Mathematics, 29.06.2019 10:30

Advanced Placement (AP), 29.06.2019 10:30


