Based on the chart for the years 1970-2010, order the regions from greatest to
least in terms...

History, 01.11.2019 09:31 aramirez4785
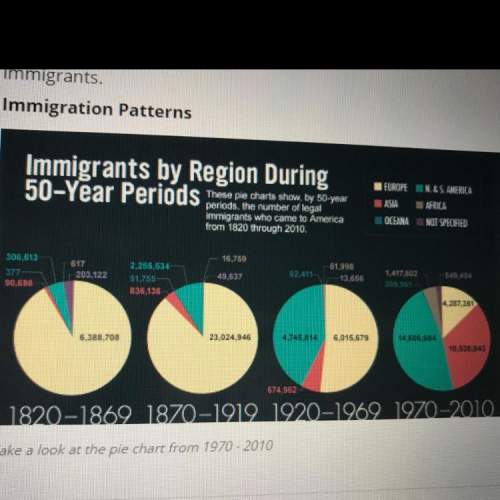
Based on the chart for the years 1970-2010, order the regions from greatest to
least in terms of how many immigrants were coming from each region. in other words, order them from biggest to smallest based on the number of immigrants.
1.africa
2. oceana
3.europe
4.not specified
5.asia
6. north and south america

Answers: 1


Other questions on the subject: History
History, 22.06.2019 01:00, brookemcelhaney
What does the document of the birtish octopus is an uderlying cause of the world war 1
Answers: 1
History, 22.06.2019 06:10, jacquetpaul1969
Match each mode of narration to the excerpt in which it is used
Answers: 3
History, 22.06.2019 07:00, lorrainelopez
What is the result of americans’ tradition of joining interest groups? a decline in political parties a large number of interest groups of all sizes a few large interest groups a large number of equally funded interest groups
Answers: 1
History, 22.06.2019 07:10, sweetluvs7865
Yes the notes gathered in your research to answer the following questions
Answers: 2
You know the right answer?
Questions in other subjects:

Mathematics, 07.01.2020 05:31
Mathematics, 07.01.2020 05:31
Engineering, 07.01.2020 05:31


English, 07.01.2020 05:31

Biology, 07.01.2020 05:31
Mathematics, 07.01.2020 05:31


