This graph shows data on deaths caused by measles. what trend does the graph show?
a. t...

History, 16.10.2019 19:30 destinymitchell966
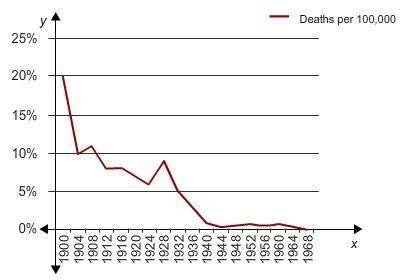
This graph shows data on deaths caused by measles. what trend does the graph show?
a. there is likely to be a big growth in the number of deaths caused by a measles outbreak before 2020.
b. the number of deaths due to measles was higher than from other diseases until 1928.
c. the number of deaths due to measles will most likely remain low in the future.
d. the number of deaths due to measles decreased each year since 1904.

Answers: 1


Other questions on the subject: History
History, 22.06.2019 09:30, foriegnngal
When lincoln was first elected president, he hoped to prevent war by allowing (1) in the united states. as time went on, he saw the (2) of the war as putting an end to slavery. once the civil war was over, president lincoln did not intend to (3) the south. he felt everyone had suffered enough. he wanted to the south, and the whole country, rebuild. the process of rebuilding the country following the civil war was called (4) the official surrender by general lee to general grant occurred at (5) and the terms were generous to the south. the terms of surrender said that the southern soldiers could go (6) and would not be prosecuted for (7) it also said that they must surrender their (8) but could keep their (9) officers were allowed to keep their (10) in order to make the achievements of the war permanent, three (11) were added to the u. s. constitution.
Answers: 2
History, 22.06.2019 13:00, richardcarmona54
Some people argue that television coverage of the vietnam war
Answers: 3
History, 22.06.2019 13:30, nickocasamplonp6mlob
Which of these would be most useful in studying the effect of germs exchanged between the new and old worlds? a. a graph showing the number of europeans between 1492 and 1600. b. a graph showing the number of native americans between 1492 and 1600. c. a primary source description of the symptoms of an unknown disease affecting native americans in 1492. o d. a primary source description of the symptoms of an unknown disease affecting europeans in 1492.
Answers: 1
You know the right answer?
Questions in other subjects:


Spanish, 10.05.2021 06:40

Mathematics, 10.05.2021 06:40

Social Studies, 10.05.2021 06:40
Mathematics, 10.05.2021 06:40


