This line graph shows the birth rate in the united states from 1950 to 2010.
which facto...

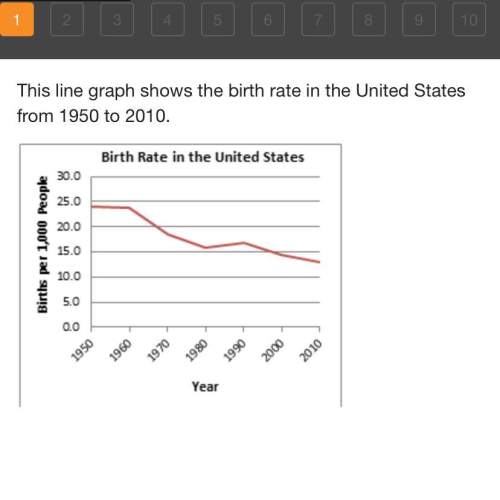
This line graph shows the birth rate in the united states from 1950 to 2010.
which factors most likely contributed to the change on this graph? check all that apply.
a) more women moving into the workforce
b) a decrease in the number of marriages
c) an increase in the number of marriages
d) greater access to birth control methods
e) advancement in equal rights for women
f) the pursuit of traditional gender roles

Answers: 2


Other questions on the subject: History
History, 21.06.2019 20:00, genyjoannerubiera
Brainliesttt asap!me : ) which of the following is not an example of cultural diffusion? a latin dance craze in canada a french pastry from a bakery in paris an indian restaurant in england a baseball game in japan
Answers: 1
History, 22.06.2019 01:50, shygirltn
Why did the meiji reformers want to modernize japan a) to colonize weaker nations in south east asia b) to allow western nations to protect them and treat negotiation c) to compete with the economics and military of western nations d) to replace additional prices with weston culture
Answers: 2
You know the right answer?
Questions in other subjects:

Biology, 31.03.2020 22:43

Mathematics, 31.03.2020 22:43
Mathematics, 31.03.2020 22:43

Mathematics, 31.03.2020 22:43
Mathematics, 31.03.2020 22:43


