

Answers: 2


Other questions on the subject: Geography
Geography, 22.06.2019 19:40, duncanje5783
Astudent conducts an experiment to see how music affects plant growth. the student obtains four identical plants. each one is potted in the same type of soil and receives the same amount of sunlight and water each day. plant a listens to classical music for three hours each day. plant b listens to rock music for three hours each day. plant c listens to country music for three hours each day. plant d does not listen to any music at all. 2. based on the experiment in the scenario, which visual aid would be most in showing the change in the plants' heights over time? a. a pie chart b. a line graph c. a timeline d. a bar graph
Answers: 3
Geography, 22.06.2019 21:30, Coolcatfurzy
Name the river that forms a natural border between new york and new jersey and is the site where a passenger jet made a miraculous landing on january 15
Answers: 2
You know the right answer?
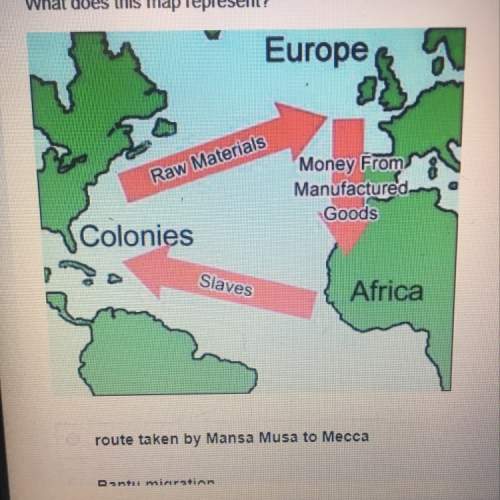
What does this map represent? a) route taken by mansa musa to mecca b) bantu migration c) triang...
Questions in other subjects:

Advanced Placement (AP), 15.11.2020 02:50

History, 15.11.2020 02:50

History, 15.11.2020 02:50
Mathematics, 15.11.2020 02:50

Health, 15.11.2020 02:50
Geography, 15.11.2020 02:50
Geography, 15.11.2020 02:50


