
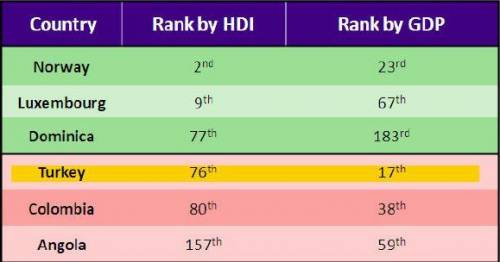
Analyze the chart below and answer the question that follows. A 3-column table with 6 rows. Column 1 is labeled Country with entries Norway, Luxembourg, Dominica, Turkey, Colombia, Angola. Column 2 is labeled Rank by H D I with entries second, ninth, seventy-seventh, seventy-sixth, eightieth, one-hundred fifty seventh. Column 3 is labeled Rank by G D P with entries twenty-third, sixty-seventh, one-hundred eighty-third, seventeenth, thirty-eighth, fifty-ninth. Data courtesy of the UN Development Programme 2006-2008 and World Bank 2009 The chart above compares measures of development using the HDI and GDP. Why might Turkey rank lower in the HDI indicator even though it has a high GDP?
A. Turkey has a lower GDP than comparable countries in the HDI ranking.
B. Turkey must increase its HDI to have a higher GDP ranking.
C. Turkey is only compared to other European countries in GDP, not to the world, as it is in the HDI.
D. Turkey may struggle to provide adequate education or health care, or it may have a lower life expectancy.

Answers: 1


Other questions on the subject: Geography
Geography, 22.06.2019 13:30, yungnoaweo4209
How do convection currents form underwater mountains?
Answers: 1
Geography, 22.06.2019 18:20, adeleinflores9402
True or false. the baltic states have taken steps to diversify. or decrease the variety of their industries
Answers: 1
Geography, 22.06.2019 23:30, antonjas001
Wich of the following is not likely to appear on a map
Answers: 1
You know the right answer?
Analyze the chart below and answer the question that follows. A 3-column table with 6 rows. Column 1...
Questions in other subjects:


Mathematics, 18.03.2021 01:20
Mathematics, 18.03.2021 01:20


Mathematics, 18.03.2021 01:20


