Geography, 01.04.2021 01:10 gabbypittman20
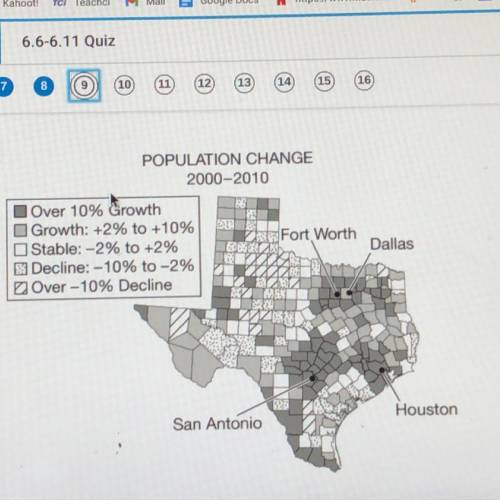
The map above shows percent change in population for counties in Texas from the 2000 to the 2010 census. The three largest metropolitan areas are Dallas-Fort Worth (Tarantino and Dallas Counties), Houston (Harris County), and San Antonio (Bexar County). Which of the following statements best explains urban growth in the period from 2000 to 2010? *IF YOUR JUST GOING TO PUT A LINK DONT COMMENT*


Answers: 2


Other questions on the subject: Geography


Geography, 23.06.2019 05:20, lindseybug
Advantages and disadvantages of mitigation and adaptation
Answers: 1

Geography, 23.06.2019 16:20, Graciesett4072
Chris lives in a city that experiences heavy rainfall with average annual precipitation of 882 millimeters. it is warm all year. mark lives in city with an average annual rainfall of 40 millimeters. it has hot summers and cool winters. chris's city is in a climate, while mark's city is in a climate.
Answers: 1

Geography, 23.06.2019 23:00, brittanysanders
Zac wanted to determine the measure of r and of ? r in the triangle below. to fine the measure of r, zac sets up the problem.42^2 + 24^2 = r 2. determine whether zac set the problem up correctly.
Answers: 3
You know the right answer?
The map above shows percent change in population for counties in Texas from the 2000 to the 2010 cen...
Questions in other subjects:


Mathematics, 31.10.2020 02:00


English, 31.10.2020 02:00


