
Geography, 12.03.2021 03:50 janeou17xn
20 POINTS
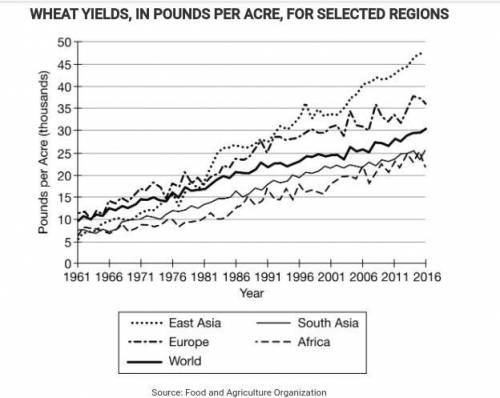
The graph shows regional and global trends in wheat farming since 1961. In this graph, the amount of wheat is measured in pounds per acre of farmland.
A. Using data on the graph, compare the wheat production trend lines of East Asia and Africa from 1961 to 1971.
B. Explain how pesticides and irrigation pumps had an effect on wheat farms in East Asia.
C. Explain why the Green Revolution had different impacts on farming in African countries compared to South Asian countries.
D. Using ONE region on the graph, explain the relationship between changes in wheat farming practices and the amount of rural-to-urban migration.

Answers: 3


Other questions on the subject: Geography
Geography, 22.06.2019 22:50, lindsey0456
[bws.05]where would uncharged particles be most likely found in an atom? o on the electrons o inside the protons o inside the nucleus outside the nucleus
Answers: 2
Geography, 23.06.2019 11:50, niniaalvarez
Audrey planned to move from iowa to arizona. en route, she was offered a job in colorado, which she accepted. she now lives in denver, colorado, and works for an athletic apparel design company.
Answers: 1
Geography, 24.06.2019 10:00, 22katelynfrankouqqrb
Which area is it likely to find the most population in an urban areaa rural area a suburban area
Answers: 1
You know the right answer?
20 POINTS
The graph shows regional and global trends in wheat farming since 1961. In this graph, th...
Questions in other subjects:


Engineering, 01.12.2021 03:50

Mathematics, 01.12.2021 03:50

Medicine, 01.12.2021 03:50

Computers and Technology, 01.12.2021 03:50


