
The graph plots observed landslide events relative to the duration and rate of
rain that happened before the event. Based on the information contained in the
graph
A) land surfaces with a steeper slope require less rain to start a landslide than shallower slopes.
B) no clear correlation exists between the duration and rate of rainfall and the occurrence of a landslide.
C) landslides after rain of a longer duration tend to be larger than those after shorter rain events.
D) if a rain event leading to a landslide was short in duration, the rain rate tended to be much higher than for other events.
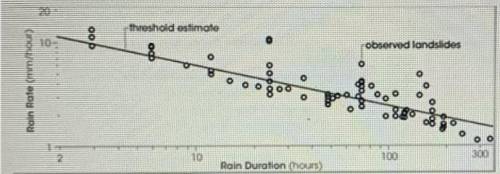

Answers: 3


Other questions on the subject: Geography
Geography, 25.06.2019 04:00, orangeicecream
Why do you think market-oriented agriculture is more productive than subsistence agriculture?
Answers: 1
You know the right answer?
The graph plots observed landslide events relative to the duration and rate of
rain that happened b...
Questions in other subjects:

Mathematics, 26.12.2022 05:20


Mathematics, 27.12.2022 08:30
Mathematics, 27.12.2022 14:00
History, 27.12.2022 14:00
History, 27.12.2022 15:20


