
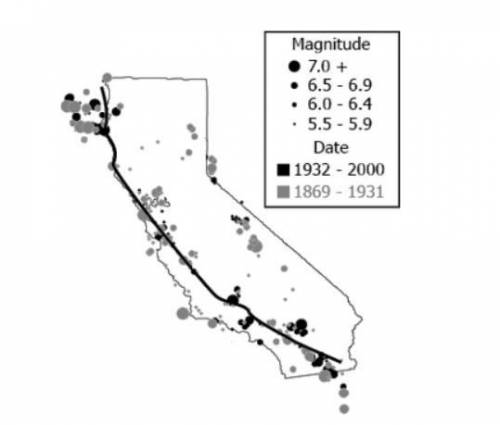
A student observes a map that shows the San Andreas fault line and some of the earthquake activity recorded in California.
(Attached image)
What can be inferred from the given data?
Question 11 options:
a. California records the most number of earthquakes.
b. The number of earthquakes decreased in the last 100 years.
c. Earthquakes of magnitudes between 5.5 and 5.9 occur only on the San Andreas Fault.
d. California recorded the least number of earthquakes near the San Andreas Fault.

Answers: 1


Other questions on the subject: Geography
Geography, 22.06.2019 04:50, eggoysters
Eysyksykfrkueykeukdlurukdlurlurlurl urulluruekukelrueukluryekkey
Answers: 2
Geography, 22.06.2019 21:50, baeethtsadia
Match the graph type to its description. 1. uses symbols to describe information pie 2. compares different quantities at the same point in time line 3. compares increases and decreases in a quantity over a period of time bar 4. shows the relationship of parts to each other and to the whole pictograph
Answers: 1
Geography, 23.06.2019 17:10, KenzieD6032
Choose the item that is an example of the geographic theme of place.
Answers: 3
You know the right answer?
A student observes a map that shows the San Andreas fault line and some of the earthquake activity r...
Questions in other subjects:


History, 24.10.2019 02:00

Social Studies, 24.10.2019 02:00


