
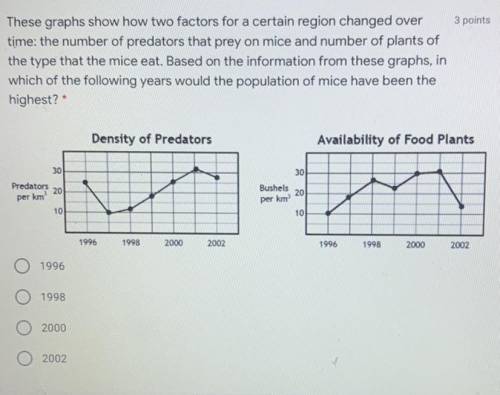
These graphs show how two factors for a certain region changed over
time: the number of predators that prey on mice and number of plants of
the type that the mice eat. Based on the information from these graphs, in
which of the following years would the population of mice have been the
highest?
A. 1996
B. 1998
C. 2000
D. 2002

Answers: 1


Other questions on the subject: Geography
Geography, 24.06.2019 02:00, kkennethbrown9222
These issues present challenges for regional urban areas. select all that apply. -housing availability -inadequate services -pollution -reduced population -rural migration
Answers: 1
Geography, 24.06.2019 06:30, smhrosepetals
b) is there any ordinal sense to zip codes? in other words, does a larger zip code tell you anything about a location compared to a smaller zip code?
Answers: 3
Geography, 24.06.2019 09:00, thebrain1345
Can you give an explanation of what medc and ledc are.
Answers: 1
You know the right answer?
These graphs show how two factors for a certain region changed over
time: the number of predators t...
Questions in other subjects:


Computers and Technology, 02.09.2020 02:01


