
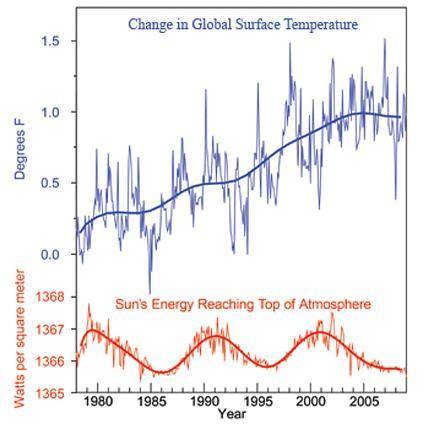
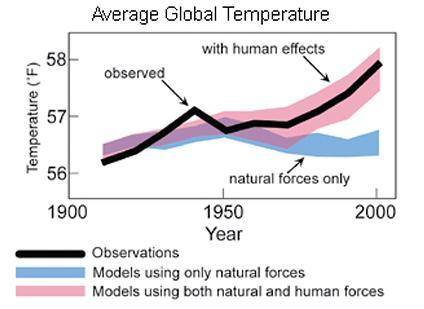
Graph 1 shows how cyclical changes in the Sun caused predictable changes in the solar intensity reaching Earth’s atmosphere. Graph 1 also shows how much the global surface temperature has moved from the long-term average. Graph 2 shows observations of global temperature (black line). The blue line is a temperature model where only natural forces, such as volcanic eruptions, are considered. The red line is a temperature model of both natural forces and human effects (activities). Study the graphs, and answer the questions that follow. Graph 1 a graph showing a constant gradual rise in global temperatures since 1980 and a graph showing that the amount of the Sun's energy reaching the atmosphere has risen and fallen regularly since 1980 Graph 2 a graph showing the observed changes in average global temperature, a temperature model that considers the effect of natural forces on temperature change, and a temperature model that considers both natural and human effects on temperature change
Part A
Based on graph 1, do you think the changes in solar intensity are a significant cause of the trend in global temperatures? Why or why not?

Answers: 1


Other questions on the subject: Geography
Geography, 23.06.2019 08:30, laureleiolson
If the basis of an isosceles trapezoid have lengths of 11 and 26, what is the length of the median?
Answers: 3
Geography, 24.06.2019 13:30, swagmonstah24
Punta arenas is the southernmost point of which country
Answers: 1
Geography, 24.06.2019 22:00, Rogeartest4
Your'e sent a set of coordinates for the city of bejing. the coordinates are 39 degrees north latitude and 116 degrees east longitude. what do these numbers tell you about
Answers: 1
You know the right answer?
Graph 1 shows how cyclical changes in the Sun caused predictable changes in the solar intensity reac...
Questions in other subjects:

Mathematics, 28.10.2019 06:31

Computers and Technology, 28.10.2019 06:31


English, 28.10.2019 06:31
Geography, 28.10.2019 06:31

History, 28.10.2019 06:31
English, 28.10.2019 06:31
History, 28.10.2019 06:31


