
Geography, 22.01.2021 14:00 aidene0311
Please helppp
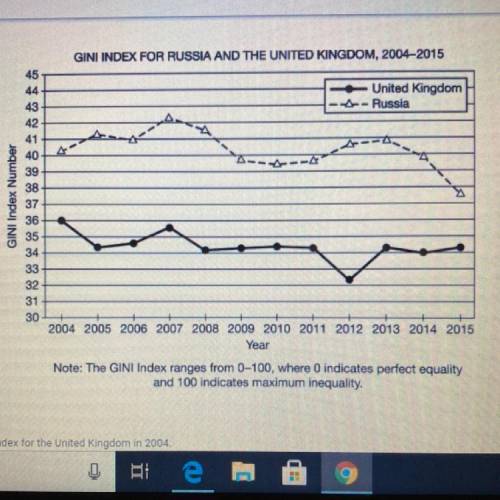
a. Using the data in the graph, describe the GINI Index for the United Kingdom in 2004.
B. Using the data in the graph, describe a trend in the data for Russia.
C. Describe what the GINI Index measures.
D. Using the data in the graph draw a conclusion about inequality in Russia.
E. Explain a consequence sometimes associated with inequality and economic liberalization for authoritarian regimes.

Answers: 1


Other questions on the subject: Geography
Geography, 22.06.2019 22:40, gggghhhhhhhhhhhh
[ou.01]which of these is the most likely use of an electromagnetic wave which has wavelength shorter than microwaves but longer than visible light? o heat food safely o neat food safely o take images of bones and teeth o transmit radio and cellular phone signals o take images of bones and teeth o transmit radio and cellular phone signals o detect the location of objects which emit heat
Answers: 1
Geography, 23.06.2019 10:30, gabestrickland2
Compare the quantity in column a with the quantity in column b. pa p a is tangent to the circle at a. column a column b ap a p ax a x question 4 options: the two quantities are equal. the quantity in column a is greater. the relationship cannot be determined from the information given. the quantity in column b is greater.
Answers: 3
You know the right answer?
Please helppp
a. Using the data in the graph, describe the GINI Index for the United Kingdom in 200...
Questions in other subjects:

Mathematics, 19.04.2021 17:50
Mathematics, 19.04.2021 17:50

Biology, 19.04.2021 17:50
Mathematics, 19.04.2021 17:50
Mathematics, 19.04.2021 17:50
Mathematics, 19.04.2021 17:50

SAT, 19.04.2021 17:50


