
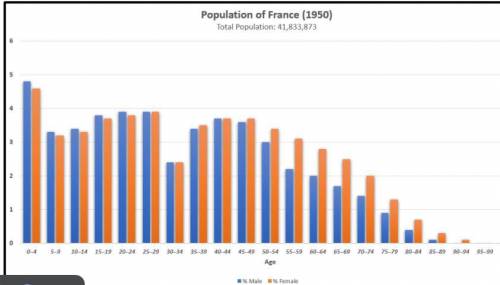
View this population chart of France in 1950. Take notes about the trends in the chart, where dips in population might occur, and the numbers of men and women in different age groups.
Part A
Using this timeline of France, hypothesize why the population chart shows a dip in the 30 to 34 year-old age group for men and women in 1950. What is one event that probably contributed to this drop?

Answers: 2


Other questions on the subject: Geography
Geography, 22.06.2019 11:00, b2cutie456
What part did glaciers play in forming the great lakes?
Answers: 1
Geography, 23.06.2019 07:00, Queenempress9380
Which season occurs in the northern hemisphere when the sun is at its lowest point in the sky
Answers: 2
Geography, 23.06.2019 20:30, 2021sherodisabella
Countries that have a traditional economy often develop at a slower pace than countries with a free market economy. true or false
Answers: 1
You know the right answer?
View this population chart of France in 1950. Take notes about the trends in the chart, where dips i...
Questions in other subjects:

Chemistry, 24.04.2020 18:21


Mathematics, 24.04.2020 18:22
Mathematics, 24.04.2020 18:22

History, 24.04.2020 18:22


