
Geography, 17.10.2020 05:01 mamabates181981
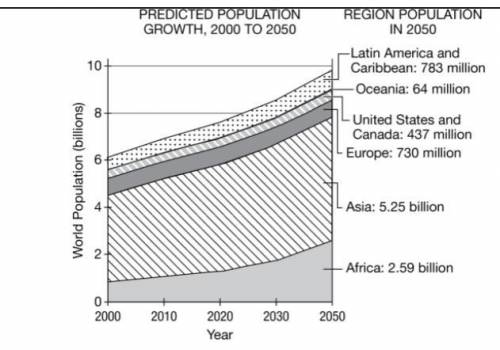
Based on the graph, predicted population growth in which of the following regions is explained by a high total fertility rate? Please help me The answer choices are the countries depicted in the graph.

Answers: 3


Other questions on the subject: Geography
Geography, 22.06.2019 21:30, htahir2345
In which area will soil formation be greatest? a a steep slope in a warm, b wet climate a flat area in a warm, c wet climate a north-facing area on a steep slope a flat area in a cold, d wet climate description
Answers: 2
Geography, 24.06.2019 10:00, payshencec21
Which of the following situations is an example of an internal migration? a. moving to mexico city, mexico b. moving to san diego, califormia c. moving to toronto, canada d. moving to london, england
Answers: 2
Geography, 24.06.2019 13:00, longoriafaithe09
This desert is found in the northern part of africa and covers 3.5 million square miles.
Answers: 1
You know the right answer?
Based on the graph, predicted population growth in which of the following regions is explained by a...
Questions in other subjects:

Biology, 22.08.2019 12:30

Computers and Technology, 22.08.2019 12:30

Physics, 22.08.2019 12:30

Mathematics, 22.08.2019 12:30
Mathematics, 22.08.2019 12:30

Mathematics, 22.08.2019 12:30


