
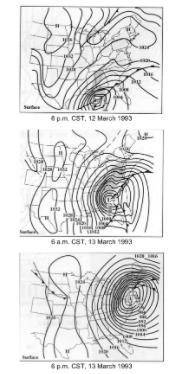
The figures below are surface weather maps from Superstorm 1993, which produced blizzard conditions across much of the eastern U. S. Hurricane-force winds were also reported along with scattered tornadoes. Overall, the storm system killed 318 people. The weather maps have isobars (labeled in millibars), low pressure, high pressure, cold fronts, warm fronts, stationary fronts, and precipitation intensity (the darker the shaded area, the more intense the precipitation) all plotted for you. Use this information to answer the following questions: What happened to the intensity of the storm as it moved from the Gulf of Mexico north-northeast across the eastern United States? Note the path of Superstorm 1993 from the top to bottom in the figures on the left. This storm produced a copious amount of rain and snow across the eastern U. S. How could the path of the storm have an influence on the amount of precipitation that fell?

Answers: 1


Other questions on the subject: Geography
Geography, 22.06.2019 10:00, goopatogen5889
What conclusión can be drawn about the middle east
Answers: 2
Geography, 23.06.2019 19:30, JvGaming2001
All of the following occurred due to the invention of the railroad except
Answers: 1
You know the right answer?
The figures below are surface weather maps from Superstorm 1993, which produced blizzard conditions...
Questions in other subjects:

Biology, 10.04.2020 07:22

Mathematics, 10.04.2020 07:22
Mathematics, 10.04.2020 07:22
Mathematics, 10.04.2020 07:22

Social Studies, 10.04.2020 07:22
Mathematics, 10.04.2020 07:22


