
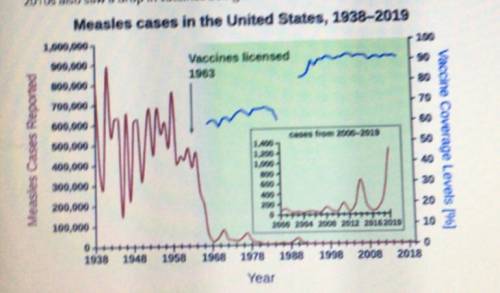
Measles is a disease that causes fever and rash. The graph gives the number of measles cases in the United States between 1938 and 2019
(measured in 100,000s.) The smaller graph shows recent outbreaks (measured in 200s.) The measles vaccine was introduced in the 1960s. The
2010s also saw a drop in vaccines being taken the United States. What can you conclude using the information in the graph?
A) Measles is the leading cause a fever for children under age 5 in the United States.
B) visitors who are not vaccinated continue to spread measles in the United States.
C) The measles vaccine had little effect on the population of the United States.
D) The measles vaccine nearly eliminated measles in the United States him.

Answers: 2


Other questions on the subject: Geography
Geography, 22.06.2019 22:30, glitterpanda2468
At which point on the diagram do convection currents occur to drive plate movement?
Answers: 1
Geography, 24.06.2019 13:00, Kellystar27
What factors result in the formation of landscapes
Answers: 1
You know the right answer?
Measles is a disease that causes fever and rash. The graph gives the number of measles cases in the...
Questions in other subjects:

French, 23.05.2020 22:03


Social Studies, 23.05.2020 22:03
Biology, 23.05.2020 22:03
Mathematics, 23.05.2020 22:03


