
Geography, 02.04.2020 02:07 inneedofhelp6237
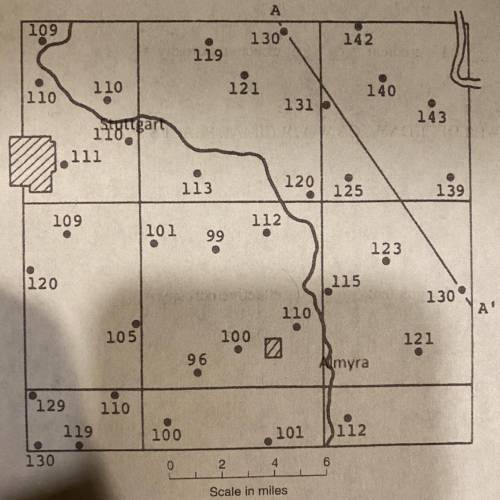
1. Draw groundwater contour lines in the following figure at 10 feet intervals. Also draw flow lines to
indicate the direction of flow of groundwater. Compare the figure after contouring with figure 16.1 to
understand the effect of declining water levels due to excess pumping

Answers: 3


Other questions on the subject: Geography
You know the right answer?
1. Draw groundwater contour lines in the following figure at 10 feet intervals. Also draw flow lines...
Questions in other subjects:


Mathematics, 28.06.2019 08:30
Mathematics, 28.06.2019 08:30

Biology, 28.06.2019 08:30

Social Studies, 28.06.2019 08:30

English, 28.06.2019 08:30
English, 28.06.2019 08:30
English, 28.06.2019 08:30


