
Engineering, 29.01.2021 07:20 richierichMBM7786
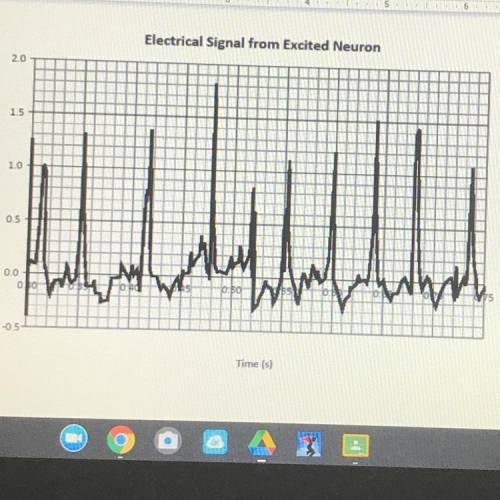
1) What is the approximate frequency of this signal in this time window? 2)How would the graph look different if the frequency was increased? Decreased? ( HELP PLEASE:)
Answers: 1


Other questions on the subject: Engineering
Engineering, 04.07.2019 08:10, doggo242
Which of the following is an easy way to remember the modified “x” tire rotation? a. nondrive wheels straight, cross the drive wheels b. drive wheels straight, cross the nondrive wheels c. drive wheels crossed, nondrive wheels straight d. drive wheels crossed, nondrive wheels crossed
Answers: 1
Engineering, 04.07.2019 18:10, jadeochoa4466
The temperature of air decreases as it is compressed by an adiabatic compressor. a)- true b)- false
Answers: 2
Engineering, 04.07.2019 18:10, 0436500
Aturning operation is performed with following conditions: rake angle of 12°, a feed of 0.35 mm/rev, and a depth of cut of 1.1 mm. the work piece is aluminum alloy 6061 with t6 heat treatment (a16061-t6). the resultant chip thickness was measured to be 1.0 mm. estimate the cutting force, fc. use shear stress of 207 mpa and coefficient of friction on the tool face of 0.6.
Answers: 1
You know the right answer?
1) What is the approximate frequency of this signal in this time window?
2)How would the graph look...
Questions in other subjects:


History, 29.07.2019 08:30


Business, 29.07.2019 08:30


