The following phase diagram shows how a catalyst affected the rate of a reaction.
which...

Chemistry, 26.09.2019 08:10 conniehodson
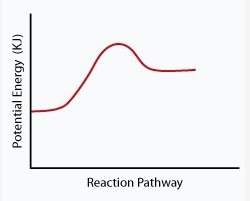
The following phase diagram shows how a catalyst affected the rate of a reaction.
which statement below best describes how the catalyst affected the reaction shown in this diagram?
a. the catalyst decreased the activation energy of the reactants.
b. the catalyst increased the activation energy of the reactants.
c. the catalyst increased activation energy of the products.
d. the catalyst decreased activation energy of the products.

Answers: 2


Other questions on the subject: Chemistry
Chemistry, 21.06.2019 22:00, carlybeavers50
The graph above shows how the price of cell phones varies with the demand quantity. the equilibrium price for cell phones is where both supply and demand quantities equal $100, 5,000 5,000, $100
Answers: 2
Chemistry, 22.06.2019 05:30, alexusnicole817
Which of the following signs of a chemical reaction are observed in the reaction of potassium with water? precipitate formed temperature change smell produced gas produced color change
Answers: 2
You know the right answer?
Questions in other subjects:


Health, 28.06.2020 15:01

Mathematics, 28.06.2020 15:01

English, 28.06.2020 15:01


