100 POINTS NEED HELP :)
Meteorology Lab Report
Introduction
Meteorologists draw...

100 POINTS NEED HELP :)
Meteorology Lab Report
Introduction
Meteorologists draw conclusions based on all known weather data. Since weather data is constantly changing, their forecast can change from day to day or from hour to hour. Now, it is your turn to predict the weather. In this lab activity, you will analyze data collected from a weather station to create a weather forecast.
Problem:
How can we use the relationships among weather data to produce a forecast?
Hypothesis/Prediction:
Based on the weather data you in Table 1 below, make a prediction about the weather from the data by completing the sentences below.. Make sure your prediction is made before you create graphs of your weather data.
If temperature _ increases/decreases, then the dew point will _increase/decrease.
If temperature _ increases/decreases, then air pressure will _ increase/decrease.
Materials:
Weather data in Table 1
Weather Maps Symbols Key (see lesson)
Graphing software or application
Graphing tutorial (optional)
Procedures:
Using the Weather Data from Table 1, construct a line graph using Time on the X axis and Temperature for the Y axis. Make sure to plot both the temperature and dew point on your graph. Be sure to include units and add titles to the graphs. Refer to the graph example and graphing tutorial in the lesson if needed.
Using the Weather Data from Table 1, construct a second line graph using Time on the X axis and Air Pressure for the Y axis. Be sure to include units and add titles to the graphs.
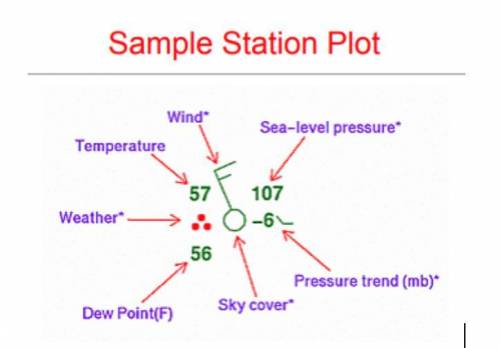
Select two different times (one day and one night) from Table 1 and create a weather station model for each. Use the example diagram in the data sections and the Weather Map Symbol Key in the lesson to guide your weather station models.
Complete the Questions and Conclusion section of the lab report.
Graph 1
You may plot the data by hand on the template below or follow the steps below to create your graph.
Double click on the graph, then select the tab labeled “sheet 1”.
Input the data from Table 1 in the corresponding columns on the spreadsheet.
Once you have input all corresponding data, select the tab labeled “Chart” at the bottom of the table to display your line graphs.
Graph 2
You may plot the data by hand on the template below or follow the steps below to create your graph.
Double click on the graph, then select the tab labeled “sheet 1”.
Input the data from Table 1 in the corresponding columns on the spreadsheet.
Once you have input all corresponding data, select the tab labeled “Chart” at the bottom of the table to display your line graphs.
Data and Observations:
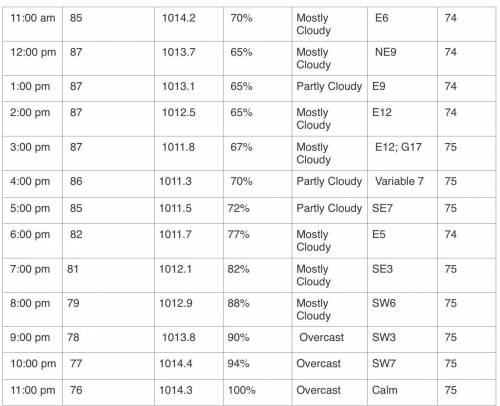
Table 1: Weather Data from Station 1, Cape Canaveral, Florida
Select two different times (one day and one night) from Table 1 and create a weather station model for each. Use the Weather Map Symbols Key from the lesson to guide your weather station models. An example is shown below. Place your weather station models under the data for each time.
DAY: _ (Time)
1. Temperature: _
2. Dew Point: _
3. Air Pressure: _ mb
4. Wind Direction—Choose One: N, NE, E, SE, S, SW, NW W
5. Wind Speed: _
6. Cloud Cover—Choose One: CLR 0%, FEW 25%, SCT 50%, BKN 75%, OVC 100%
Place Weather Station Model here.
NIGHT: _ (Time)
1. Temperature: _
2. Dew Point: _
3. Air Pressure: _mb
4. Wind Direction—Choose One: N, NE, E, SE, S, SW, NW W
5. Wind Speed: _
6. Cloud Cover—Choose One: CLR 0%, FEW 25%, SCT 50%, BKN 75%, OVC 100%
Place Weather Station Model here.
Questions and Conclusion
Write a summary of the weather that occurred during the 24 hours in Table 1.
What are the possible sources of error in the weather data?
Based on your graphs, what relationships do you notice between temperature, dew point, humidity, cloud cover, and air pressure? Provide evidence of your conclusion.


Answers: 1


Other questions on the subject: Chemistry
Chemistry, 22.06.2019 08:30, ayaanwaseem
For each of the compounds below, show that the charges on the ions add up to zero. a. kbr b. cao c. li(2)o d. cacl(2) e. alcl(3)
Answers: 2
Chemistry, 22.06.2019 08:30, lpssprinklezlps
What method(s) do plants use to obtain nitrogen? select all that apply. absorb it from the atmosphere use bacteria to convert nitrogen to usable form obtain usable nitrogen compounds from the soil absorb nitrogen from water taken in at the roots
Answers: 3
Chemistry, 22.06.2019 11:00, RidhaH
Which statement correctly identifies the scientific question and describes why the question is scientific? question 1 refers to the supernatural. question 2 reflects a moral or social value. question 3 refers to something that can be measured. question 4 reflects a question that can’t be observed.
Answers: 1
You know the right answer?
Questions in other subjects:

Mathematics, 30.04.2021 08:10

English, 30.04.2021 08:10
Mathematics, 30.04.2021 08:10

Health, 30.04.2021 08:10
Mathematics, 30.04.2021 08:10
Mathematics, 30.04.2021 08:20
Mathematics, 30.04.2021 08:20
Mathematics, 30.04.2021 08:20
Mathematics, 30.04.2021 08:20


