
Chemistry, 24.07.2021 23:50 fatamhassan21
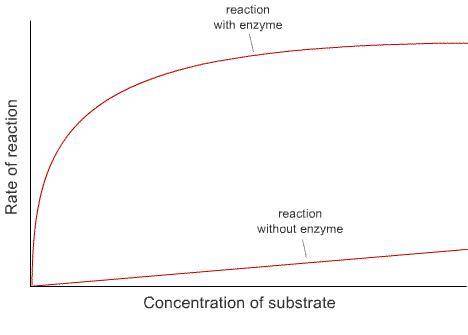
This graph shows the rates of reaction in a chemical reaction with and without the addition of an enzyme.
• Explain the shape of each line. What is happening to the reaction rate as the reactant concentration
is changed?
• Explain what the enzyme appears to be doing.
• Why does the curve of the reaction with enzyme flatten out?
P. S if you will coppy the answer from previous question or say some nonsense just to get points, I will report you and you wont get any:)

Answers: 3


Other questions on the subject: Chemistry
Chemistry, 22.06.2019 23:00, lulprettyb
What is the most common reason for matter changing its state?
Answers: 1
You know the right answer?
This graph shows the rates of reaction in a chemical reaction with and without the addition of an en...
Questions in other subjects:


Mathematics, 09.02.2021 21:00

Biology, 09.02.2021 21:00


