
Chemistry, 04.06.2021 23:10 ElegantEmerald
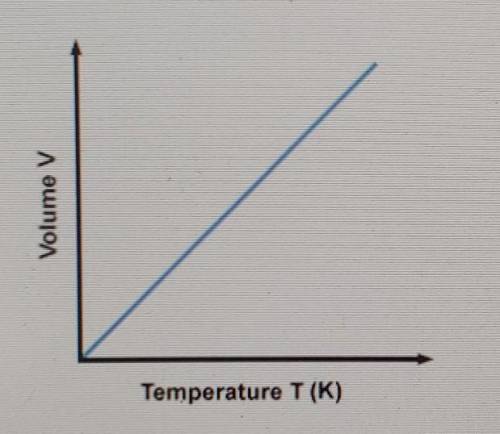
The graph shows a relationship between volume and temperature. Which of the following statements is true?
A.) The graph shows a directly proportional relationship between volume and temperature and represents Charles' Law.
B.) The graph shows an indirectly proportional relationship between volume and temperature and represents Boyle's Law.
C.) The graph shows an indirectly proportional relationship between volume and temperature and represents Gay-Lussac's Law.
4.) The graph indicates that when temperature is increased, volume decreases.

Answers: 1


Other questions on the subject: Chemistry
Chemistry, 22.06.2019 12:30, murtaghliam1
Word equation for k(s) +h2o(l) yield koh (aq) + h2
Answers: 3
Chemistry, 22.06.2019 17:50, mytymikey123
You exhale co2 which is produced during cellular respiration. co2 combines with the water in your blood's plasma to make up one half of the body's most important buffer pair, carbonic acid. the more physical activity you engage in, the more co2 your body is producing. you can see this by putting some of the cabbage indicator in a glass and then blowing bubbles into it through a straw. can you see a change in the color of the indicator?
Answers: 2
Chemistry, 23.06.2019 04:00, zakarycrane8101
If you are told to get 100 ml of stock solution to use to prepare smaller size sample for an experiment, which piece of glassware would you use?
Answers: 3
You know the right answer?
The graph shows a relationship between volume and temperature. Which of the following statements is...
Questions in other subjects:

Mathematics, 11.04.2021 14:00

English, 11.04.2021 14:00

Biology, 11.04.2021 14:00

Arts, 11.04.2021 14:00

Health, 11.04.2021 14:00
English, 11.04.2021 14:00
Mathematics, 11.04.2021 14:00
English, 11.04.2021 14:00


