
Chemistry, 03.06.2021 18:00 hjeffrey168
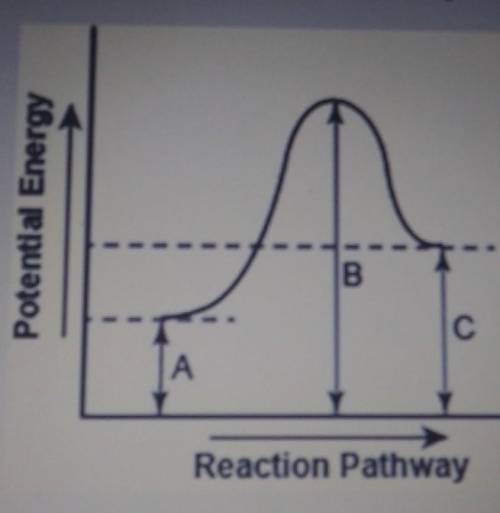
The diagram below shows the potential energy changes for a reaction pathway.
Part 1: Does the diagram illustrate an enothermic or an exothermic reaction? Give reasons to support your answer.
Part 2: Describe how you can determine the total change in ethalpy and activation energy from the diagram and if each is positive or negative.
Brainliest if you give the definition of endo and exothermic reactions, and how you know the change in enthalpy even if you put nothing else.

Answers: 3


Other questions on the subject: Chemistry
Chemistry, 22.06.2019 00:30, boonkgang6821
The clouds are grey and ground is wet. a quantitative b qualitative
Answers: 1
Chemistry, 22.06.2019 22:30, eduardoguizar8787
Which one of the following bonds would you expect to be the most polar? a) b–h b) n–h c) p–h d) al–h e) c–h
Answers: 1
Chemistry, 22.06.2019 23:00, ceejay8005
The data below were determined for the reaction shown below. s2o82– + 3i – (aq) → 2so42– + i3– expt. # [s2o82–] (m) [i –] (m) initial rate 1 0.038 0.060 1.4 × 10 – 5 m/s 2 0.076 0.060 2.8 × 10 – 5 m/s 3 0.076 0.030 1.4 × 10 – 5 m/s the rate law for this reaction must be:
Answers: 1
You know the right answer?
The diagram below shows the potential energy changes for a reaction pathway.
Part 1: Does the diagr...
Questions in other subjects:


Mathematics, 02.04.2020 05:06

Biology, 02.04.2020 05:06
Mathematics, 02.04.2020 05:06
Mathematics, 02.04.2020 05:06

Mathematics, 02.04.2020 05:06
History, 02.04.2020 05:06


