
Chemistry, 25.05.2021 21:10 desiree3114
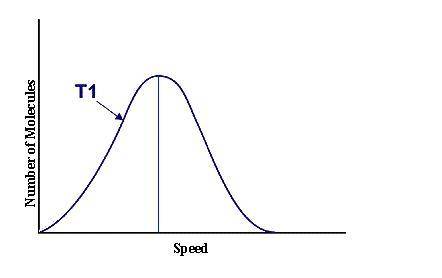
This graph represents a population of molecules in a gas versus the distribution of the average velocity(speed) of its molecules in that population. Assume all molecules to be of the same mass. In reading the graph, it is important to note three things. One, is the most probable speed is at the peak of the curve. Secondly, the most probable speed increases as the temperature increases (so shift to the right), and the distribution broadens as it increases.
On the graph, indicate the average kinetic energy of the population.
Explain your answer.
What part of the graph indicates the temperature of the sample?
Explain your answer.
Sketch a curve that represents the distribution of molecules at a temperature below the one shown. Label it as T2. Describe both T and T2 in terms of their average kinetic energy. Be specific and detailed.
Submit your answer below.

Answers: 1


Other questions on the subject: Chemistry
Chemistry, 22.06.2019 11:50, hadwell34
Which of the following statements about hybrid orbitals is or are true? choose all that apply. choose all that apply. under sp2 hybridization, the large lobes point to the vertices of an equilateral triangle. after an atom undergoes sp hybridization there is one unhybridized p orbital on the atom. the angle between the large lobes of sp3 hybrids is 109.5∘
Answers: 2
Chemistry, 22.06.2019 16:10, sierram298
Amixture initially contains a, b, and c in the following concentrations: [a] = 0.300 m , [b] = 1.05 m , and [c] = 0.550 m . the following reaction occurs and equilibrium is established: a+2b⇌c at equilibrium, [a] = 0.140 m and [c] = 0.710 m . calculate the value of the equilibrium constant, kc.
Answers: 1
You know the right answer?
This graph represents a population of molecules in a gas versus the distribution of the average velo...
Questions in other subjects:


Social Studies, 13.07.2020 23:01

Biology, 13.07.2020 23:01


